La’o Hamutuk |
Reference | Presentations | Mission Statement | LH Blog | Search | Home |
|
Petroleum-related excerpts from |
| 06-07 | 2007 | 2008 | 2009 | 2010 | 2011 | Total | |
|---|---|---|---|---|---|---|---|
| Total Revenue | 1 ,063.8 | 714.3 | 1,385.6 | 1,185.1 | 1,257.5 | 1,250.4 | 5,078.6 |
| Total Expenditure | 161.9 | 114.9 | 347.8 | 282.9 | 272.3 | 278.8 | 1,181.8 |
| Fiscal Balance | 901.9 | 599.4 | 1,037.9 | 902.2 | 985.2 | 971.6 | 3,896.8 |
| Non Petroleum Fiscal Balance | (102.5) | (97.9) | (320.8) | (256.3) | (244.9) | (214.7) | (1036.7) |
| Donor Funding Confirmed | Due to limitiations on time and incomplete data sets 2006-07 donor funding has been ommitted. Information on development partner financed activities are estimates and may vary. | 98.5 | 154.7 | 114.2 | 74.5 | 46.3 | 389.7 |
| Total Combined Sources Spending | 161.9 | 213.4 | 502.5 | 397.2 | 346.8 | 325.1 | 1,571.5 |
Table 2.2
Financing of the Combined Sources Budget 2006-07 to 2011 ($m)
| 2006-07 Actual | 2007 Estimate | 2008 Estimate | 2009 Estimate | 2010 Estimate | 2011 Estimate | Total | |
|---|---|---|---|---|---|---|---|
Revenue | 59.3 | 115.5 | 181.7 | 140.8 | 102.0 | 144.3 | 568.8 |
Domestic Revenue | 40.9 | 14.4 | 20.7 | 20.1 | 20.8 | 76.0 | 137.6 |
Direct Budget Support | 11.4 | - | - | - | - | - | - |
Autonomous Agency Revenue | 7.0 | 2.5 | 6.3 | 6.5 | 6.7 | 22.0 | 41.6 |
Confirmed Donor Funding | 98.5 | 154.7 | 114.2 | 74.5 | 46.3 | 389.7 | |
Expenses | 161.9 | 213.4 | 502.5 | 397.2 | 346.8 | 325.1 | 1,571.5 |
Recurrent Expenditure | 150.2 | 201.9 | 428.5 | 347.7 | 314.9 | 294.2 | 1,385.3 |
State Budget Funding | 150.2 | 110.5 | 280.1 | 235.4 | 240.8 | 248.3 | 1,004.6 |
Confirmed Donor Funding | 91.4 | 148.4 | 112.3 | 74.1 | 46.0 | 380.7 | |
Capital Expenditure | 11.6 | 11.5 | 73.9 | 49.4 | 32.0 | 30.9 | 186.2 |
State Budget Funding | 11.6 | 4.4 | 67.6 | 47.5 | 31.6 | 30.6 | 177.3 |
Confirmed Capital Funding | 7.1 | 6.3 | 1.9 | 0.4 | 0.3 | 9.0 | |
Expenses | |||||||
Transfer from the Petroleum Fund | 102.5 | 40.0 | 294.0 | 256.3 | 244.9 | 214.7 | 1,009.9 |
Existing Cash Reserves | - | (57.9) | (26.8) | - | - | - | (26.8) |
The Economy
The non-oil economy is projected to have rebounded in 2007, growing by around 8% (excluding UN activities). This reflects higher government spending and the increased international presence, which more than offset the negative impact on agriculture from drought and locust infestations.
The rebound of the economy is evidenced in a significant increase in trade. Total imports in the first seven months of 2007 amounted to $91 million, an increase of 80% from the monthly average in 2006. This increase stems from a large increase in purchases of capital goods, such as machinery and transport equipment and other equipments. Exports, which are mostly coffee, are of a much smaller magnitude and amounted to less than $1m during January to July 2007.
Annual inflation peaked at about 17% in February 2007, boosted by a regional rice shortage and local supply disruptions related to the unrest. Inflation subsequently retreated to 7.2% by September 2007, and is expected to moderate further as the impact of supply shocks subside.
The government budget for 2008 will provide additional stimulus to the economy and support long term development. At 347.8 million, total budget spending is only about 3% higher than the budget for fiscal year 2006/07 but steps to improve budget execution are expected to yield significant improvements in actual spending. If fully executed, overall cash outlays in 2008 would increase by some 80% compared to FY2006/07. Moreover, a series of large infrastructure projects, now in the planning phase, will provide essential support to the development of the country as they are realized over the next several years. To counteract inflationary pressure associated with the expansion of public sector activity, the government is determined to maintain tight expenditure controls and address emerging bottlenecks on the supply side of the economy as they appear. This will help ensure that higher spending is fully matched by quality outcomes.
Overall, the non-oil economy is projected to expand by 6.5% in 2008. This expansion is driven primarily by an increase in public spending, reflecting the larger government budget and improved implementation. The agricultural sector is expected to stay relatively subdued, in line with recent trends. The rest of the private sector is benefiting from fewer security related-disruptions and the indirect effects of a greater international presence. Nevertheless, despite pick-ups in construction and services, the private sector is relatively small and the government remains the engine of growth, with private investment representing just a small fraction of the total.
Revenue, Sustainable Income and the Petroleum Fund
The actual petroleum revenue, excluding the returns on petroleum fund investments for the fiscal year 2006/07 was $956.2m. Petroleum revenue excluding the returns on petroleum fund investments for 2008 is estimated to be $1,249.9m. The Estimated Sustainable Income for the Budget year 2008 is estimated at $294m. This is an increase of $23m compared to the calculation for the same period in the Transitional Budget 2007.
Table 2.3
Estimated Petroleum Revenue and Sustainable Income
| 06-07 | 2007 | 2008 | 2009 | 2010 | 2011 | |
|---|---|---|---|---|---|---|
| Sustainable Revenue | 283.3 | 133.0 | 294.0 | 298.0 | 301.7 | 305.4 |
| Estimated/Actual Withdrawals | 260.1 | 40.0 | 294.0 | 298.0 | 301.7 | 305.4 |
Note 2: The Budget assumes that future spending by Government will reach sustainable income levels. The forward estimates of expenditure show only planned spending.
Domestic revenue for the transition period from 1 July to 31 December 2007 is estimated to be $17.0 million. Domestic revenue for 2008 is forecast to be $27.0 million. This number incorporates the prescribed reforms to the domestic tax system of Timor-Leste which will reduce domestic tax revenue by approximately 50%. In 2008 the Government will introduce reforms to the taxation system of Timor-Leste which will lead to improving the competitiveness of Timor-Leste in the region. Some brief details on these reforms are provided below.
In regard to the Petroleum Fund the Government wants to outsource a substantial part of the portfolio to external managers and has authorized the BPA to initiate contract negotiations with the World Bank and the Bank for International Settlements, which are the two most relevant non commercial external investment managers.
The Government is considering increasing the investment universe and including other fixed income assets in the portfolio. There are other fixed income assets with higher expected return than US government fixed income assets.
The Petroleum Fund is estimated to reach $3.116m by December 2008 rising to $5,785.9m in December 2011.
Table 2.4
Estimated Balances of the Petroleum Fund 2006-07 to 2011 ($m)
| 06-07 | 2007 | 2008 | 2009 | 2010 | 2011 | |
|---|---|---|---|---|---|---|
| Opening Balance | 649.8 | 1,394.2 | 2,051.5 | 3,116.1 | 3,976.7 | 4,905.0 |
Petroleum Revenue | 956.2 | 634.1 | 1,249.9 | 1,009.2 | 1,043.1 | 961.3 |
Interest | 48.3 | 63.2 | 108.7 | 149.3 | 186.9 | 225.0 |
Withdrawal | 260.1 | 40.0 | 294.0 | 298.0 | 301.7 | 305.4 |
| Closing Balance | 1,394.2 | 2,051.5 | 3,116.1 | 3,976.7 | 4,905.0 | 5,785.9 |
General Budget of the State for Timor-Leste
The 2008 Budget is the first full year budget of the IVth Constitutional Government. The 2008 State Budget is designed to provide a more substantial contribution towards resolving the issues underlying national poverty whilst introducing a process of reforming the administration of the civil service and developing the new national plan . The Government will continue to focus on ensuring strong economic growth as one of the key policy drivers to reducing national poverty. The Government will maintain high levels of public spending and improve budget execution to create an environment that supports private sector growth and investment -- supporting employment and job creation. The 2008 State Budget will also focus on improvements to critical service provision and support for the veterans and vulnerable groups. It will support the re-establishment of security across the country and increase the provision of services to the community in the areas of:
The State Budget for 2008 is $347.8m, an increase of 8.1% on the annualised transition budget figure. Future spending in Table 2.5 shows a fall in expenditure, these estimates however show only the concrete activities the Government has planned and has not included amounts for predicted spending.
Table 2.5
Budget of the State Whole of State Aggregate Figures 2005-06 to 2011 ($m)
| 06-07 | 2007 | 2008 | 2009 | 2010 | 2011 | Total | |
|---|---|---|---|---|---|---|---|
Total Expenditure | 160.4 | 116.5 | 347.8 | 280.1 | 269.0 | 1,013.3 | 1,910 |
Salary & Wages | 33.8 | 19.5 | 48.0 | 52.2 | 53.2 | 54.2 | 208 |
Good & Services | 93.9 | 73.1 | 143.7 | 138.8 | 143.0 | 148.3 | 574 |
Minor Capital | 9.3 | 3.0 | 24.5 | 0.0 | 0.0 | 0.0 | 25 |
Capital Development | 11.7 | 8.7 | 67.6 | 47.5 | 31.6 | 30.6 | 177 |
Transfers | 11.8 | 12.1 | 63.9 | 41.6 | 41.2 | 41.3 | 188 |
Salaries
Total salaries in 2008 are inclusive of the civil service subsidy which was introduced into the State Budget after the crisis of 2006 and maintained in the 2007 Transition Budget. Previously, the civil service subsidy was included in the Goods and Services category. The movement of the subsidy is responsible for the majority of changes. Staffing levels have experienced only minor increases.
As part of the process of administrative reform, the Government will develop a career regime for the civil service for implementation in 2008 that will promote efficiency and provide opportunities for career development and progression.
Goods and Services
As part of its commitment to transparent and accountable Government financing, all Organs of State are aiming to ensure that funds are spent strategically, transparently and represent good value for money. Organs of the State will be regularly audited and financial reports and information made more readily available.
In line with the approach first adopted in the Transition Budget, where there is an option to increase efficiency, administrative functions for activities such as payment of rent, utilities and travel costs have been centralised within each Ministry. Significant Whole of Government expenditure such as provision of fuel, international memberships and overseas travel remain centralised in the whole of Government funds managed by the Ministry of Finance. The civil service subsidy is no longer included in the Goods and Services category.
Public Transfers
Public Transfers are an excellent method to direct funding to areas of the population in greatest need of support. In 2008, the Government will administer transfer programs to the value of $63.9m to provide personal benefit payments to Veterans as well the frail elderly and disadvantaged in the community. The Government will also administer transfer programs that provide public grants to the Church, NGOs and civil society groups who will implement programs and deliver services to the population in areas such as education, sport, training and research. Some of the major activities include:
Transfers for Territory Administration
Capital Expenditure
The Government is conscious of the difficulties with spending in this category. As a result the Capital and Development programme for 2008 is a modest but realistic plan which will lead to improved infrastructure and more employment opportunities. Capital expenditure in 2006-07 was $11.6 million, the Government expects to execute the majority of the $68.0m which has been budgeted as well as execute the carryover from 2006-07 and previous years.
Table 2.6
General Budget of the State Timor-Leste 2006-7 to 2011 ($m)
| 2006-07 Actual | 2007 Estimate | 2008 Estimate | 2009 Estimate | 2010 Estimate | 2011 Estimate | 4 year total | |
|---|---|---|---|---|---|---|---|
| General Government | |||||||
| Revenue | 1,056.8 | 711.7 | 1,379.3 | 1,178.6 | 1,250.8 | 1,243.5 | 5,052.3 |
Petroleum Revenue | 1,004.5 | 697.3 | 1,358.6 | 1,158.5 | 1,230.0 | 1,186.3 | 4933.4 |
Taxes and Royalties | 954.1 | 634.1 | 1,249.7 | 1,009.0 | 1,042.9 | 961.1 | 4262.8 |
Petroleum Fund Interest | 48.3 | 63.2 | 108.7 | 149.3 | 186.9 | 225.0 | 669.9 |
Other Petroleum Revenue | 2.1 | - | 0.2 | 0.2 | 0.2 | 0.2 | 0.8 |
Domestic Revenue | 40.9 | 14.4 | 20.7 | 20.1 | 20.8 | 57.2 | 118.8 |
Direct Tax | 11.8 | 4.1 | 3.2 | 3.3 | 3.4 | 13.5 | 23.4 |
Indirect Tax | 19.3 | 5.0 | 8.3 | 8.5 | 8.9 | 35.0 | 60.7 |
User Fees | 4.7 | 2.3 | 5.1 | 5.2 | 5.4 | 5.6 | 21.3 |
Interest | 5.1 | 3.0 | 4.1 | 3.0 | 3.1 | 3.1 | 13.3 |
Direct Budget Support | 11.4 | - | - | - | - | - | |
| Expenses | 138.7 | 91.8 | 319.2 | 262.4 | 251.8 | 258.2 | 1,091.6 |
Salaries and Wages | 33.1 | 19.2 | 46.7 | 50.9 | 51.9 | 52.9 | 202.3 |
Goods and Services | 73.2 | 57.5 | 124.4 | 122.5 | 127.2 | 133.5 | 507.6 |
Minor Capital | 9.1 | 3.0 | 23.8 | - | - | - | 23.8 |
Capital and Development | 11.6 | 0.1 | 60.5 | 47.4 | 31.6 | 30.6 | 170.0 |
Public Transfer Payments | 11.8 | 12.1 | 63.9 | 41.6 | 41.2 | 41.3 | 187.9 |
| Subsidies | 16.1 | 20.6 | 22.2 | 14.1 | 12.9 | 9.2 | 58.4 |
Operational Subsidies for Autonomous Agencies | 16.1 | 16.3 | 15.0 | 13.9 | 12.9 | 9.2 | 51.1 |
Capital Investment for Autonomous Agencies | 0.1 | 4.3 | 7.2 | 0.1 | - | - | 7.3 |
| General Government Budget Balance | 901.9 | 599.3 | 1,037.9 | 902.2 | 986.2 | 976.1 | 3,902.3 |
| Autonomous Agencies | |||||||
| Revenue | 23.1 | 23.1 | 28.5 | 20.5 | 19.5 | 16.1 | 84.7 |
Subsidies from General Government | 16.1 | 20.6 | 22.2 | 14.1 | 12.9 | 9.2 | 58.4 |
Autonomous Agencies Charges | 7.0 | 2.5 | 6.3 | 6.5 | 6.7 | 6.8 | 26.3 |
| Expenses | 23.1 | 23.1 | 28.5 | 20.5 | 20.5 | 20.6 | 90.3 |
Salaries and Wages | 0.7 | 0.5 | 1.4 | 1.3 | 1.3 | 1.3 | 5.4 |
Goods and Services | 22.1 | 16.3 | 19.3 | 19.1 | 19.2 | 19.3 | 76.9 |
Minor Capital | 0.2 | 2.1 | 0.7 | - | - | - | 0.7 |
Capital and Development | 0.1 | 4.3 | 7.2 | 0.1 | - | - | 7.3 |
Current Transfers | - | - | - | - | - | - | - |
| Autonomous Agencies Budget Balance | - | - | - | - | (1.0) | (4.6) | (5.6) |
| Total Petroleum Revenue Whole of Government | 1,063.8 | 714.3 | 1,385.6 | 1,185.1 | 1,257.5 | 1,250.4 | 5,078.6 |
Total Non Petroleum Revenue Whole of Government | 47.9 | 17.0 | 27.0 | 26.6 | 27.5 | 64.1 | 145.2 |
| Total Expenditure - Whole of Government | 160.4 | 116.5 | 347.8 | 282.9 | 272.3 | 278.8 | 1,181.8 |
| Fiscal balances | |||||||
Whole of State Fiscal Balance | 901.9 | 599.4 | 1,037.9 | 902.2 | 985.2 | 971.6 | 3,896.9 |
Whole of State Fiscal Balance Non Petroleum | (102.5) | (97.9) | (320.8) | (256.3) | (244.9) | (214.7) | (1,036.7) |
| Financing Requirement | |||||||
Cash Required from the Petroleum Fund | 102.5 | 40.0 | 294.0 | 256.3 | 244.9 | 214.7 | 1,009.9 |
Financing from Existing Cash Balances | - | 57.9 | 26.8 | - | - | - | 26.8 |
...
Total revenue for the 2008 State Budget is estimated to be $ 1,385.6 as detailed in Table 6.1. This revenue is comprised of:
Petroleum revenues (including interest from the petroleum fund)
Domestic taxes;
User fees and charges;
Interest earned on cash balances of the State;
Autonomous agency fees.
Table 6.1
Total Revenue 2006-07 to 2011 ($m)
| 2006-07 | 2007 | 2008 | 2009 | 2010 | 2011 | Total | |
|---|---|---|---|---|---|---|---|
| Total Revenue | 1,063.8 | 714.3 | 1,385.6 | 1,185.1 | 1,257.5 | 1,214.7 | 5,042.9 |
Petroleum Revenue | 1,004.5 | 697.3 | 1,358.6 | 1,158.5 | 1,230.0 | 1,186.3 | 4,933.4 |
Domestic Taxes | 31.1 | 9.1 | 11.5 | 11.8 | 12.3 | 12.8 | 48.5 |
User fees and Charges | 4.7 | 2.3 | 5.1 | 5.2 | 5.4 | 5.6 | 21.3 |
Interest | 5.1 | 3.0 | 4.1 | 3.0 | 3.1 | 3.1 | 13.4 |
Autonomous Agencies | 7.0 | 2.5 | 6.3 | 6.5 | 6.7 | 6.8 | 26.3 |
Direct Budget Support | 11.4 | - | - | - | - | - |
Petroleum Sector
Currently there is only one field in operation in the Joint Petroleum Development Area (JPDA). The Bayu-Undan field is still in its early stage. It is expected that it will continue to generate revenue for the State of Timor-Leste until 2023.
Peak production is expected to occur in 2008. The latest estimated production schedules are provided in Table 6.4. Production data is updated on annual basis after the realisation of actual data. Projection estimates are provided in Chart 6.1.
Chart 6.1
Petroleum Production Estimates 2006-07, Total Revenue 2006-07 2008 Budget (mill barrels oil equivalent)
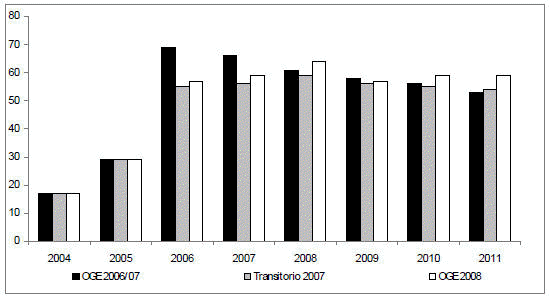
The latest updated production projection shows an increase in the production of condensate whilst the production of Liquefied Petroleum Gas (LPG) is expected to decline slightly. The production of Liquefied Natural Gas (LNG) is expected to accelerate. More revenue is now expected to be received at an earlier stage in the production life of the Bayu Undan Field.
During 2007 there was a scheduled shut down of five weeks during September and October 2007 for the regular maintenance.
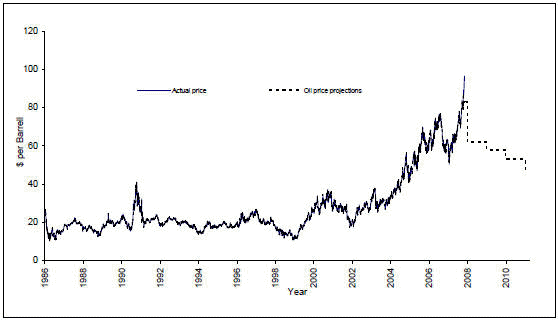
At the time of writing oil prices were generally higher than those assumed for calculating petroleum revenue in 2007. The actual average oil price in 2007 for the period from January to October 2007 was $68 per barrel, compared to the forecast of $65 per barrel in 2007 assumed in the 2006/07 budget.
The Ministry of Finance has increased this assumption to $73 per barrel, due to the higher than expected oil prices in the last quarter which will be above the average to October 2007.
Petroleum Fund
The actual petroleum revenue, excluding the returns on petroleum fund investments for the fiscal year 2006/07 was $956.2m. The revenue forecast for the transitional period 01 July to 31 December 2007 is $634.1 million. [Actual revenues were $640.1m -- LH.] The forecast is based on a combination of actual revenues received into the Petroleum Fund up to the end of the third quarter, plus a forecast for the fourth quarter.
Table 6.2
Estimated Petroleum Fund Savings 2006-07 to 2011 ($m)
| 2006-07 | 2007 | 2008 | 2009 | 2010 | 2011 | |
|---|---|---|---|---|---|---|
| Opening Balance | 649.8 | 1,394.2 | 2,051.5 | 3,116.1 | 3,976.7 | 4,905.0 |
| Petroleum Revenue | 956.2 | 634.1 | 1,249.9 | 1,009.2 | 1,043.1 | 961.3 |
| Interest | 48.3 | 63.2 | 108.7 | 149.3 | 186.9 | 225.0 |
| Withdrawal | 260.1 | 40.0 | 294.0 | 298.0 | 301.7 | 305.4 |
| Closing Balance | 1,394.2 | 2,051.5 | 3,116.1 | 3,976.7 | 4,905.0 | 5,785.9 |
Correspondingly, petroleum revenue excluding the returns on petroleum fund investments for 2008 is estimated to be $1,249.9m, this assumes oil prices (West Texas Intermediate (WTI)) will average $73 per barrel and $62 per barrel during 2007 and 2008 respectively. Chart 6.2 illustrates the historical nominal changes in the oil price and the assumptions used in calculating future petroleum revenue.
Chart 6.2
Changes in World Oil Price WTI Basis ($ Per Barrel)
The actual return on petroleum fund investments in 2006/07 was $48.3m. The return forecast for the transition period of 1 July to 31 December 2007 is $63.2m. Based on the current investment strategy and a US Government bond yield of 4.3%, the return on the investments for 2008 is estimated at $108.7m.
Chart 6.3 shows the recent changes in the 0-5 years US Government yield curve.
Chart 6.3
US Government 0-5 years yield curve
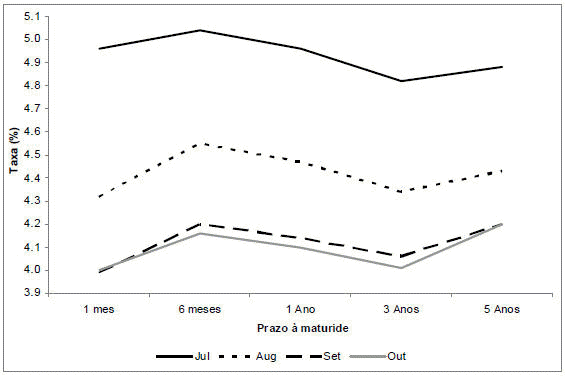
Source: Federal Reserve (http://www.federalreserve.gov)
Table 6.3
Estimated Petroleum Revenue 2006-07 to 2011 ($m)
| 2006-07 | 2007 | 2008 | 2009 | 2010 | 2011 | Total | |
|---|---|---|---|---|---|---|---|
| Total Petroleum Revenue | 1,004.5 | 697.3 | 1,358.6 | 1,158.5 | 1,230.0 | 1,186.3 | 4,933.4 |
Royalties | 114.0 | 63.0 | 104.0 | 83.5 | 81.3 | 72.1 | 340.9 |
Profit oil | 343.6 | 397.0 | 624.2 | 557.0 | 559.2 | 525.6 | 2,266.1 |
Income Tax | 437.9 | 116.5 | 165.5 | 121.1 | 182.9 | 150.7 | 620.2 |
Additional Profit Tax | 38.3 | 53.1 | 338.4 | 228.5 | 202.4 | 195.4 | 964.6 |
Value Added Tax | 6.4 | 2.4 | 5.5 | 6.7 | 4.8 | 4.8 | 21.8 |
Wages Tax | 7.5 | 2.1 | 5.0 | 5.0 | 5.1 | 5.3 | 20.4 |
Pipeline Payments | 6.3 | - | 7.2 | 7.2 | 7.2 | 7.2 | 28.8 |
Other Payments | - | - | 0.2 | 0.2 | 0.2 | 0.2 | 0.8 |
Withholding Tax | 2.1 | - | - | - | - | - | - |
Petroleum Fund Interest | 48.3 | 63.2 | 108.7 | 149.3 | 186.9 | 225.0 | 669.9 |
The balance of the Petroleum Fund as at 30 September 2007 was $1,818m. By the end of 2007 the balance is expected to be $2,052 million. [The actual balance at the end of 2007 was $2,086m -- LH.] The Fund is expected to increase steadily in the medium term. The current forecast shows the total value of the Fund by the end of 2008 to be $3,116m and by the end of 2011, $5,786 million.
Petroleum Revenues, Wealth and Sustainable Income
Total Petroleum Wealth is estimated to be $9,811m as of 1 January 2007. In addition to the total value of Petroleum Fund as at 1 January 2007, the Petroleum Wealth also consists of a Net Present Value (NPV) of future petroleum revenue of $7,759 million. The estimated Petroleum Wealth has increased by $943m compared to the calculations provided in the Transitional Budget 2007.
According to the Petroleum Fund Law the Estimated Sustainable Income (ESI) shall be 3% of the Petroleum Wealth. Correspondingly, the Estimated Sustainable Income for the Budget year 2008 is estimated at $294m. This is an increase of $23m compared to the calculation for the same period in the Transitional Budget 2007, where the ESI for 2008 was estimated to be $271m. This increase in the ESI is due to a lower discount rate, increased expected production and higher actual oil prices in 2007 than anticipated. On the other hand, higher production costs offset part of this increase resulting in a net increase of $23 million.
Chart 6.4
Timor-Leste Petroleum Revenue and Sustainable Income 2002 to 2023 (nominal prices)
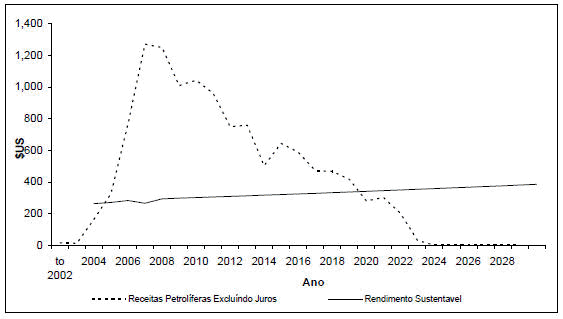
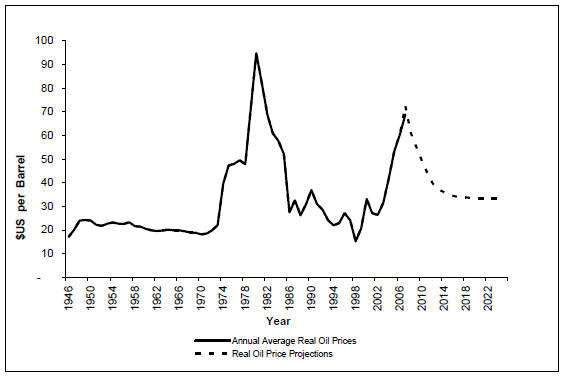
Chart 6.4 illustrates the long term level of ESI and petroleum revenue to be received up until 2023.
Oil prices used in this calculation are lower than current market prices. It should be noted that calculations are based on prices that are significantly higher than seen only a few years ago, and oil prices have displayed volatility over time. In real terms oil prices in the seventies were substantially higher than oil prices observed in the market today. The projected oil price in constant 2007 prices, as assumed in the ESI calculations for 2008, is higher than the historical oil price level.
Chart 6.5
Historical and Projected Oil Prices in Real Terms (2007 Prices)
Review of Methodology
The Petroleum Fund Act presupposes that the average nominal yield on US Government securities should be used when calculating the present value of the future cash flow from the petroleum sector. In October 2007 this rate was about 4.3%, which has been chosen as the discount rate for the calculations.
Using a risk free interest rate when calculating the present value of future revenue has implications for the assumptions used, when estimating the cash flow. There should be a substantial likelihood that the cash flow will materialize. The State Budget estimates production on the basis of the operator’s “Low” estimate. The Low estimate is that there is a 90% likelihood that predicted production levels will be achieved. There are no similar types of price estimates available. The State Budget uses the low price case of a respected and credible forecaster as a basis for making the price assumptions. Oil prices are based on Annual Energy Outlook 2007 published by the US Government’s Energy Information Administration (EIA). This is the same approach used in the Transitional Budget for 2007.
Timor-Leste does not have a range of petroleum fields from which it gains petroleum revenue, as a result there are risks associated with petroleum revenue. The risk, however small, is that an event on the Bayu Undan field will cause a deferral of the revenue stream to the State of Timor-Leste. Such a deferral may last for months, years or even indefinitely, depending on the event. Furthermore, oil prices are very volatile, and it should not be ruled out that oil prices fall to or below the price assumptions used in the calculations of the Petroleum Fund.
In calculating the Petroleum Wealth only fields in production are included. As there is no development plan for the Greater Sunrise field yet, potential Timor-Leste revenues from this field are not included in the Petroleum Wealth, nor are potential revenues from the acreages opened for exploration.
Table 6.4
Sustainable Income Calculations - Oil Price Assumptions ($ per Barrel), Production and Revenue Forecast
2002 to 2023
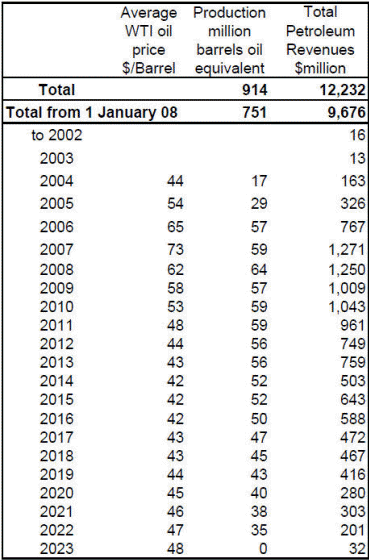
Note 4: The figures represent undiscounted revenues to the Petroleum Fund, whereas petroleum wealth represents the Net Present Value of the future revenues and the current balance of the petroleum fund.
Sensitivity
There are a range of risks and uncertainties in any forecast of petroleum revenues. The most sensitive assumption is oil price, meaning that the forecast of petroleum revenues changes substantially even from a relatively small change in assumed oil prices.
Other uncertainties include LNG contract volume and pricing terms, condensate and LPG spot sales prices relative to oil prices, operating costs and inflation. The Ministry of Finance has endeavoured to adopt prudent assumptions in all cases.
Table 6.5 shows the sensitivity of Petroleum Revenues, Petroleum Wealth and Estimated Sustainable Income to changes in production and prices.
Table 6.5
Sustainable Income Calculations – Sensitivity Analysis ($m)
| Low Price | MoF Case | High Price | Expected Production | |
|---|---|---|---|---|
Petroleum Receipts 1 Jan 2008 to 31 Dec 2024 | 6,918 | 9,676 | 12,432 | 11,221 |
Petroleum Wealth at 31 Dec 2007 | 7,674 | 9,811 | 11,946 | 10,784 |
Estimated Sustainable Income 2008 | 230 | 294 | 358 | 324 |
Note 5: The 2008 State Budget is based on the Ministry of Finance case (MoF Case). The low price is based on oil prices at $10 per barrel lower than that assumed by MoF officials; high price is based on oil prices $10 per barrel higher than that assumed by MoF officials. Expected production is based on the operators expected production rather than the low production estimate (P90).
Investment strategy of the Petroleum Fund
According to Articles 14 and 15 in the Petroleum Fund Law at least 90% of the amounts in the Petroleum Fund shall be invested in fixed income instruments (bonds) denominated in United States dollars with a certain credit rating and/or issued by certain banks and agencies. Not more than 10% may be invested in other financial instruments, provided that these are issued abroad, liquid and transparent and traded in a financial market of the highest regulatory standard. According to Article 11 in the Petroleum Fund Law the Central Bank (the Banking and Payments Authority) shall be responsible for the operational management of the Fund and the Fund shall be managed prudently in accordance with the principle of good governance for the benefit of current and future generations.
The investment universe set out in the Petroleum Fund Law is further narrowed through the Operational Management Agreement between the Ministry of Finance and the Banking and Payments Authority (BPA) dated 12 October 2005. According to this Agreement the assets of the Fund shall only be invested in debt instruments issued by the United States and other qualifying sovereign governments and the Merrill Lynch 0-5 year government bond index shall be used to measure the performance of the Fund. BPA’s investment mandate is to manage the Fund passively close to the benchmark.
The BPA has managed the Fund in accordance with its investment mandate. The Fund is currently invested in ten different US government bonds and the annual investment return since the inception of the Fund (Sep 2005 – Sep 2007) has been 4.4%. This is in line with the benchmark, i.e. the performance of the Fund has been in accordance with the fixed income market in general. In the same period the annual return in the equity market (S&P 500 ) was 12.7%. However, the volatility in the equity market was higher in this period, too. In general, the expected return in the fixed income market is lower than in the equity market due to lower risks.
The current investment strategy is based on a prudent approach and lessons learnt from other countries. Many countries have faced challenges managing revenues from natural resource wealth. Bad and unsustainable management has often resulted in the so-called resource curse, where revenues from natural resources have not given any significant contribution to the economic growth and welfare for the population in the country. Thus, it has been important for Timor-Leste to gradually build internal capacity in order to establish a sound and sustainable management of the Petroleum Fund . So far this strategy has been successful.
However, the value of the Petroleum Fund is steadily increasing and there is a potential for further increase in the return on the investments. Thus, the Government is considering the current investment strategy and the management of the Fund with the aim to fully explore the possibilities within the Petroleum Fund Law to maximise the total value of the revenues from the petroleum sector.
The Investment Advisory Board has recommended authorizing the BPA to enter into contract negotiations with non commercial external investment managers. Through outsourcing part of the management of the Petroleum Fund to external investment managers, the operational risks can be reduced and the internal capacity through training activities and transfer of knowledge can be increased. This strategy may also increase the return on the investments if this combines with a wider investment mandate. The Government wants to outsource a substantial part of the portfolio to external managers and has authorized the BPA to initiate contract negotiations with the World Bank and the Bank for International Settlements, which are the two most relevant non commercial external investment managers.
Furthermore, the Government is considering increasing the investment universe and including other fixed income assets in the portfolio. There are other fixed income assets with higher expected return than US government fixed income assets, e.g. with higher credit risk and/or interest risk, that are among the qualifying instruments in the Petroleum Fund Law.
It is the Government’s aim to fully explore the range of qualifying instruments that is regulated in the current Petroleum Fund Law, including investing up to 10% in equities. The Government has started a process to consider this issue. Such a strategy may increase the return at the same time as the risk decline, due to the correlation between the market for fixed income assets and equities.
According to Article 14.3 in the Petroleum Fund Law, the range of instruments included as qualifying instruments in the Law shall be reviewed by the Government, and approved by Parliament, at the end of the first five (5) years of the Petroleum Fund existence, having regard to the size of the Petroleum Fund and the level of institutional capacity. The Government will start this review process in 2008.
The Timor-Leste Institute for Development Monitoring and Analysis (La’o Hamutuk) |